- TOPLEY'S TOP 10
- Posts
- Topley's Top 10
Topley's Top 10
The Magnificent 2
)..
1. The Magnificent 2

@CharlieBilello
..
2. MAGS Mag 7 ETF Chart …Sideways Since Sept 2025

Stock Charts
..
3. Software Forward PE Drop ….Forward P/E of Software ETF 55x to 35x

Perplexity.ai
..
4. IGV Software ETF Right on Liberation Day Lows

Stock Charts
..
5. Private Equity ETF PSP Failed 4x at New Highs

Stock Charts
.
6. Defensives Still Close to Lowest Weighting in S&P 500 Since 1990
After a fascinating week in markets, today’s CoTD —updated from last week’s pack (link here)—shows that US defensive stocks remain close to the "cheapest" levels we’ve seen since our dataset begins in 1990. In other words, even with the recent rotation out of tech, the broader picture still shows limited impact when you zoom out.
For more colour on positioning and flows behind the recent equity move, see Parag Thatte’s latest weekly report (link here). Two themes stand out:
Tech bounced on Friday from the bottom of its 10-year relative channel versus the S&P 500. Notably, it was sitting at the top of that channel back in October when the rotation began.
The rotation away from tech began around the time Q3 earnings revealed a broadening of earnings growth—from a narrow set of sectors (mainly tech) to most sectors.
This second point is particularly interesting: improving earnings elsewhere may have helped create the conditions for the tech sell-off just as much as anything happening within tech itself. And while tech still shows the strongest earnings growth, today’s chart suggests that as other sectors improve, relative valuations become compelling enough for investors to reallocate.

Deutsche Bank Research
.
7. Murder Rate Per 100,000 People

Semafor
.
8. Source of Power by State 2025
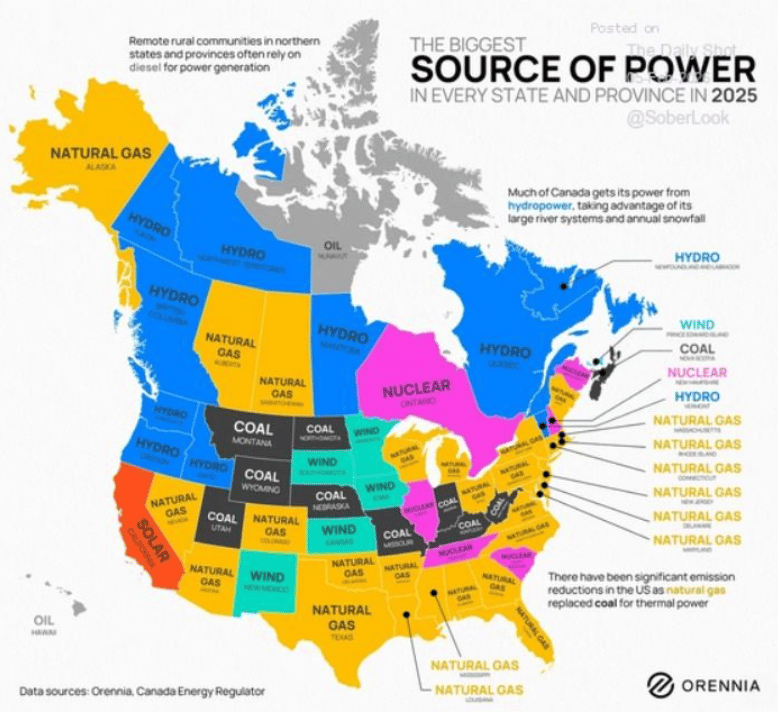
Orennia
….
9. Unemployment Rate for College Grads in U.S. 2.5%-2.8%....Vs. China/India

Perplexity.ai
..
10. Super-Aged Societies-Demographics is Destiny

Visual Capitalist
.
Did someone forward this email to you? Get your own:
Disclosure
Indices that may be included herein are unmanaged indices and one cannot directly invest in an index. Index returns do not reflect the impact of any management fees, transaction costs or expenses. The index information included herein is for illustrative purposes only.
Material for market review represents an assessment of the market environment at a specific point in time and is not intended to be a forecast of future events, or a guarantee of future results.
Material compiled by Lansing Street Advisors is based on publicly available data at the time of compilation. Lansing Street Advisors makes no warranties or representation of any kind relating to the accuracy, completeness or timeliness of the data and shall not have liability for any damages of any kind relating to the use such data.
To the extent that content includes references to securities, those references do not constitute an offer or solicitation to buy, sell or hold such security as information is provided for educational purposes only. Articles should not be considered investment advice and the information contain within should not be relied upon in assessing whether or not to invest in any securities or asset classes mentioned. Articles have been prepared without regard to the individual financial circumstances and objectives of persons who receive it. Securities discussed may not be suitable for all investors. Please keep in mind that a company’s past financial performance, including the performance of its share price, does not guarantee future results.
Lansing Street Advisors is a registered investment adviser with the State of Pennsylvania.