- TOPLEY'S TOP 10
- Posts
- Topley's Top 10
Topley's Top 10
Defensive Stocks Expensive According to PEG Ratio
)..
1. Defensive Stocks Expensive According to PEG Ratio
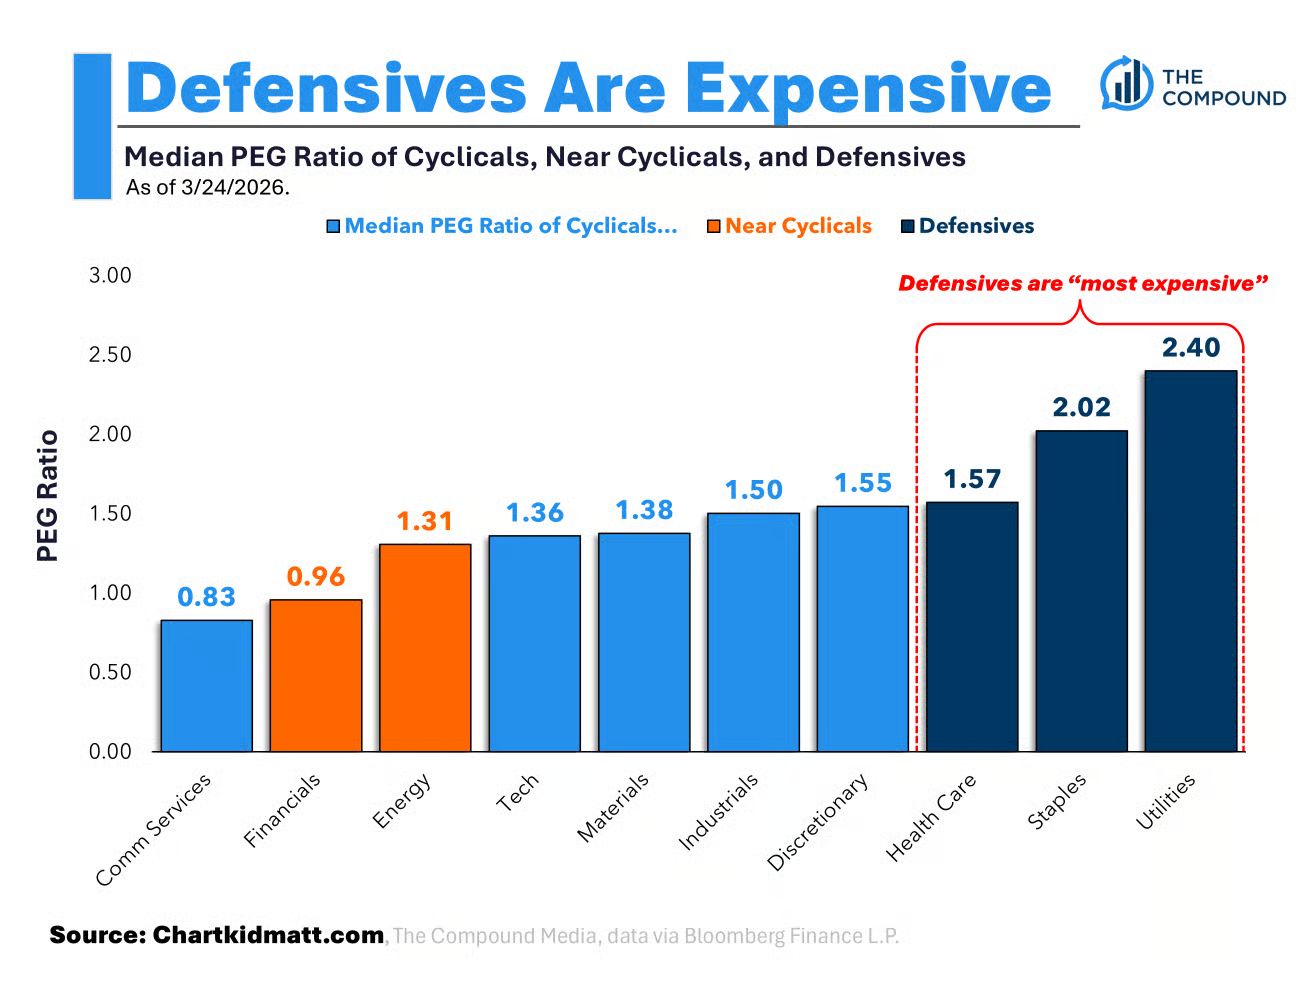
Chart Kid Matt The PEG ratio adjusts “P/E” for “long-term earnings growth”.
Higher earnings growth relative to P/E will get you a lower PEG
Lower earnings growth relative to P/E will get you a higher PEG
Earnings growth is assessed on a forward basis based on consensus estimates.
The point is, P/E has little value without understanding how the “E” is expected to change in the future.
Because PEG takes the forward change of the “E” into account, I think it’s a superior fundamental metric to watch than just looking at the P/E.
So in today’s chart, I took the Russell 3000 constituents with available data and plotted the median PEG ratio by sector.
I want to see where the “cheap” and “expensive” stocks are based on this metric.
Here it is, sorted by Cyclicals, Near Cyclicals, and Defensives:
Remember, a higher PEG ratio means a “higher valuation.”
..
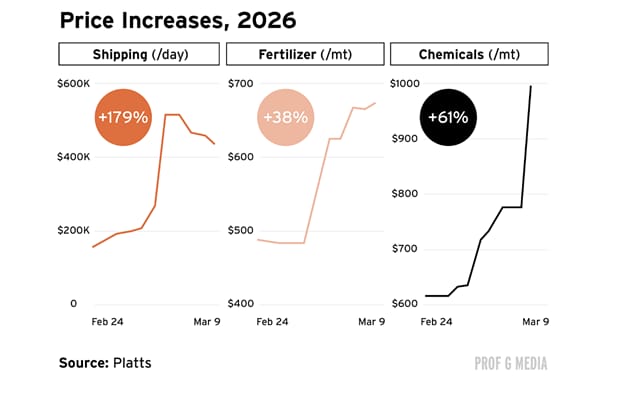
2. Price Increases Shipping, Fertilizer, and Chemicals-Ed Elson
Prof G Markets
..
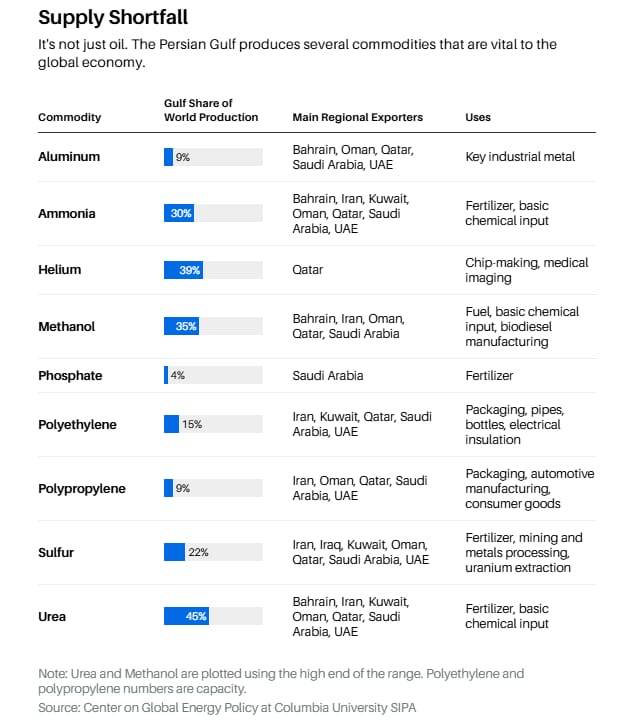
3. Gulf Share of World Production-Barrons
Barron's
..
4. Prices Since Start of Iran War
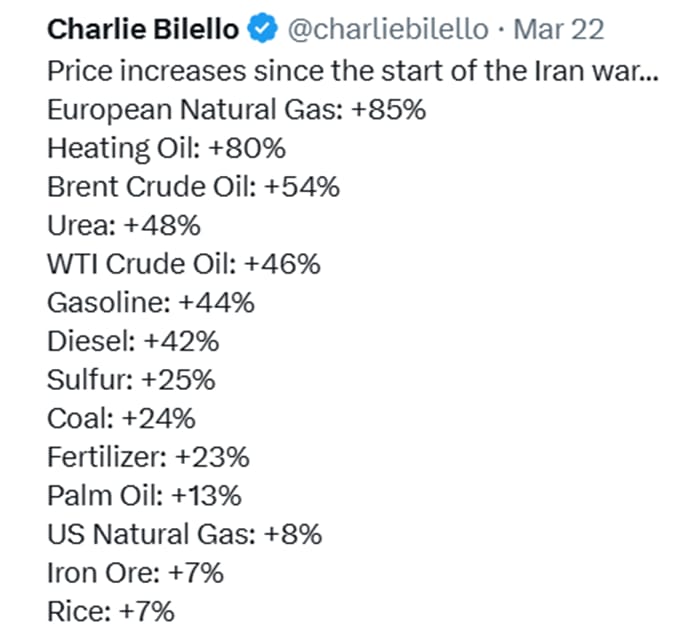
@Charlie Bilello
..
5. Investors Selling Consumer Discretionary Stocks Due to Higher Inflation….XLY -10% …Close Below 200-Day
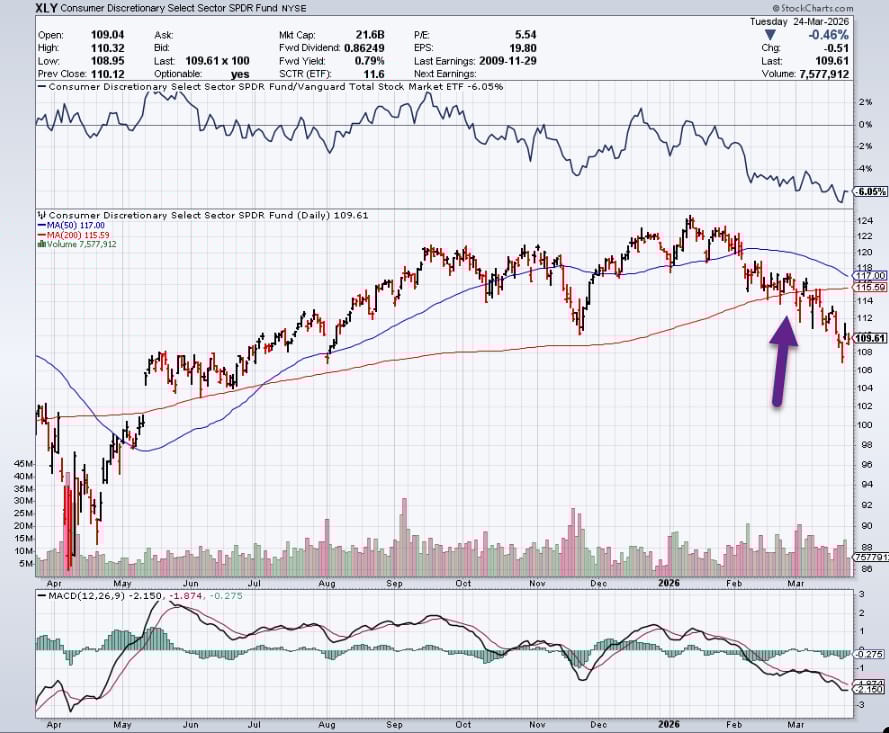
StockCharts
.
6. Traders placed $580mn in oil bets ahead of Donald Trump’s social media post on Iran talks Thousands of Brent and WTI contracts changed hands 15 minutes before president’s message on Truth Social-FT
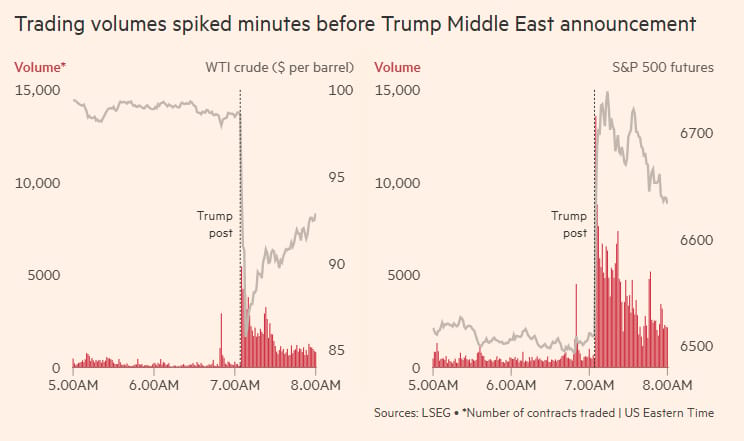
Financial Times
.
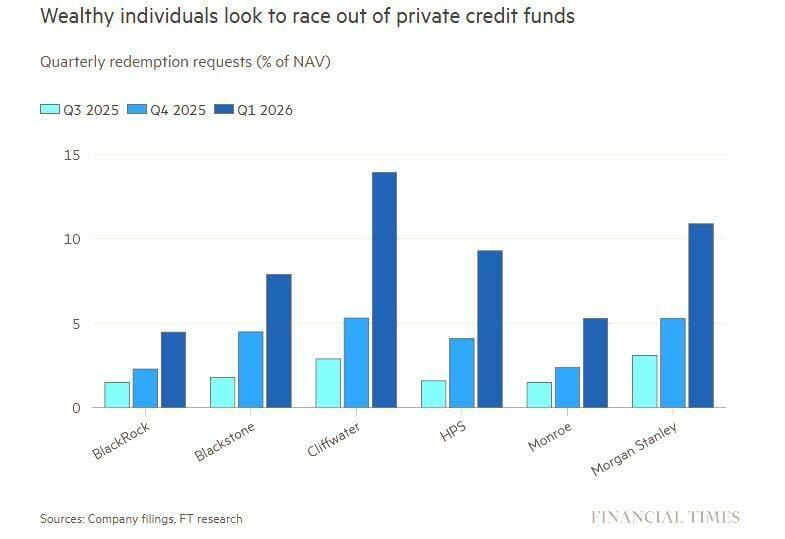
7. Summary of Withdraw Requests from Private Equity Credit Funds
.
8. INDIA Highest AI Adoption Rate

Visual Capitalist
….
9. Americans Large House vs. Small House
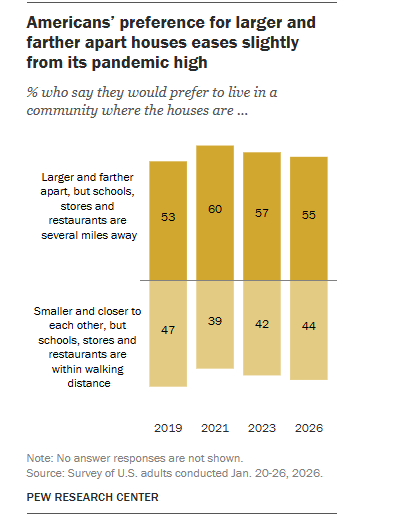
Pew Research Center
..
10. Look for Green Flags Not Red Flags
We were taught to look out for red flags. Little signs that something is wrong, that we should be careful or even turn around.
Don’t let that distract you from being on the lookout for green flags.
We might need encouragement to leap forward. If you look for the green flags, you’re more likely to find them.
..
Did someone forward this email to you? Get your own:
Disclosure
Indices that may be included herein are unmanaged indices and one cannot directly invest in an index. Index returns do not reflect the impact of any management fees, transaction costs or expenses. The index information included herein is for illustrative purposes only.
Material for market review represents an assessment of the market environment at a specific point in time and is not intended to be a forecast of future events, or a guarantee of future results.
Material compiled by Lansing Street Advisors is based on publicly available data at the time of compilation. Lansing Street Advisors makes no warranties or representation of any kind relating to the accuracy, completeness or timeliness of the data and shall not have liability for any damages of any kind relating to the use such data.
To the extent that content includes references to securities, those references do not constitute an offer or solicitation to buy, sell or hold such security as information is provided for educational purposes only. Articles should not be considered investment advice and the information contain within should not be relied upon in assessing whether or not to invest in any securities or asset classes mentioned. Articles have been prepared without regard to the individual financial circumstances and objectives of persons who receive it. Securities discussed may not be suitable for all investors. Please keep in mind that a company’s past financial performance, including the performance of its share price, does not guarantee future results.
Lansing Street Advisors is a registered investment adviser with the State of Pennsylvania.