- TOPLEY'S TOP 10
- Posts
- Topley's Top 10
Topley's Top 10
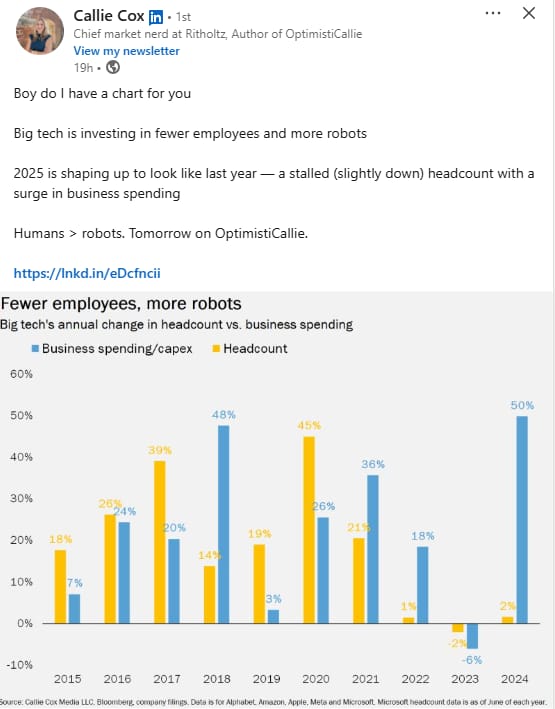
Big Tech—Capex vs. Headcount
2
1. Big Tech—Capex vs. Headcount

Callie Cox
…
2. Top 10 S&P Stocks are 40% of Market Cap and 33% of Profits
Zach Goldberg Jefferies The top 10 stocks in the S&P 500 now account for 40% of the market cap and 33% of the profits...Source: SocGen

…
3. Biotech Venture Investing Down 75%

Venture capital
…
4. Insider Buying Lowest Since 2018
Dave Lutz Jones Trading Insiders at just 151 S&P 500 companies bought their own stocks last month, the fewest since at least 2018, according to data compiled by the Washington Service. And while July’s selling by corporate insiders slowed from June’s pace, purchases dropped even more, pushing the ratio of buying-to-selling to the lowest level in a year, the data shows.

…
5. Tokenization Market Value

Charts tell stories. Hockey-stick charts tell big stories. One of the biggest stories today is that tokenization — the idea of moving stocks, bonds, and other real-world assets over blockchains instead of traditional networks — is having a moment. Not only has it catapulted from zero to a $25 billion market in four years. But suddenly some of the biggest players in finance are talking about it. Think about that for a second. Stocks are a $117 trillion market. Bonds are a $140 trillion market. That’s $257 trillion up for grabs in the tokenization wars. |
…
6. Private Equity Stocks Performance vs. Their Funds Performance Last 3 Years

Joshua Brown
…
7. Annual Percent of 1% Daily S&P Moves vs. History

Nasdaq Dorsey Wright
8. Demographics is Destiny….Single…China’s Fastest Growing Households

…
9. Total U.S. Retirement Assets $43.4 Trillion….401ks $12.2 Trillion

The Lead Left
…
10. 8 Phrases That Make You Sound Smarter

The Productive Leader
…
Did someone forward this email to you? Get your own:
Disclosure
Indices that may be included herein are unmanaged indices and one cannot directly invest in an index. Index returns do not reflect the impact of any management fees, transaction costs or expenses. The index information included herein is for illustrative purposes only.
Material for market review represents an assessment of the market environment at a specific point in time and is not intended to be a forecast of future events, or a guarantee of future results.
Material compiled by Lansing Street Advisors is based on publicly available data at the time of compilation. Lansing Street Advisors makes no warranties or representation of any kind relating to the accuracy, completeness or timeliness of the data and shall not have liability for any damages of any kind relating to the use such data.
To the extent that content includes references to securities, those references do not constitute an offer or solicitation to buy, sell or hold such security as information is provided for educational purposes only. Articles should not be considered investment advice and the information contain within should not be relied upon in assessing whether or not to invest in any securities or asset classes mentioned. Articles have been prepared without regard to the individual financial circumstances and objectives of persons who receive it. Securities discussed may not be suitable for all investors. Please keep in mind that a company’s past financial performance, including the performance of its share price, does not guarantee future results.
Lansing Street Advisors is a registered investment adviser with the State of Pennsylvania.